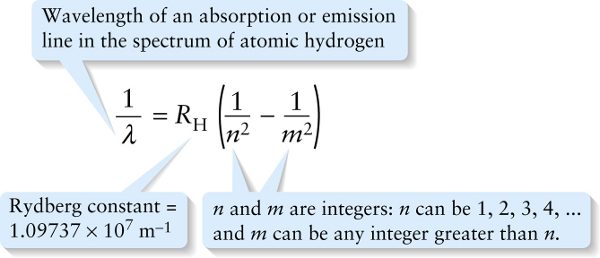
Chapter 26. Rydberg formula for the spectral lines of hydrogen (26-14)
Question
WzpzpVSOUnEdQ4v7YErENSy0dQakIZq3gf2ybUtqxseyoMb9R//raScxeeTLa2JLNSavCrGNoi1BF9WbptAj8clalb8zzR6xWyeuaeHngsmEHB3kmgbA+NaO8pW/P97bI0IzEg==
Question
L/MUjuimajKs5QizXqoDv+JE4Seb4hFMyv/mw+MY/Dmqu2nb4GPY+kqat8H+DSNqhpnGWOAJ+WcHbqVZS8VolA5If/ZqNvEAitD4jp4pJxgBDMeuwboucz1H9fYQhSJqdDKz17ypKfx48Pfsc2YVFg==
Question
dJ5OGMgbe1hxYnBrC9pvYhk3IgJsW+NC8frjX8fR4+I19txGcVCdNKDQhJ4G1JquHqga+QTYSde/ec/MSZpt0Q==
Review
The value of the constant \(R_{\mathrm{H}}\) in Equation 26-14, called the Rydberg constant, is chosen to match the experimental data. To four significant figures, \(R_{\mathrm{H}} = 1.097 \times 10^7\ \mathrm{m}^{-1}\) As an example, the hydrogen absorption and emission lines shown in Figure 26-12 all correspond to \(n =2\) in Equation 26-14. The series of wavelengths for which \(n =2\) are called the Balmer series.
